


1. Introduction
Target date funds (TDFs) have become one of the most popular investment tools for investors and pension sponsors in recent years, particularly following the passage of the Pension Protection Act of 2006 that allowed firms to offer TDFs as default options in their employer-sponsored defined contribution pension plans (Balduzzi and Reuter, 2019). Once the investors set their âtarget years,â usually coinciding with retirement, TDFs automatically engage in asset reallocation as their stated target years draw near, reducing the investment in risky equity and alternative investments in favor of fixed income instruments. This is referred to as the âglide pathâ of TDFs. The market for TDFs has substantially grown over the past 15 years, from $70 billion in 2005 to over $1.8 trillion by 2021.1) Yet, despite their growing prominence within the fund industry, TDF investorsâ response to the COVID-19 pandemic, particularly with regards to any change in concavity or convexity in the flow-performance relationship, has yet to be examined. This paper fills the gap in the literature by examining investor flows into and out of TDFs as well as the asymmetry in flow-performance relationship around the COVID-19 market turmoil.
Examining TDF investorsâ flow response to the COVID-19 pandemic is important for the following reasons. During the COVID-19 market crash of March 2020, open-end bond funds witnessed an unprecedented sell-off by their investors amounting to $264 billion in a single month (Ma, Xiao, and Zeng, 2022). The severe outflows appear to have been driven by strategic complementarity inherent in corporate bond funds arising from the liquidity mismatch between the fundâs underlying holdings and investorsâ redemption orders, which enables redeeming investors to exit from the fund at an advantageous NAV that does not fully reflect the subsequent liquidation costs (e.g., Chen, Goldstein, and Jiang, 2010; Goldstein, Jiang, and Ng, 2017).2)
Although these bond funds often hold cash instruments as buffers to absorb the liquidity costs of inflows and outflows (Chernenko and Sunderam, 2020; Jiang, Li, and Wang, 2021), another important âinsuranceâ mechanism highlighted in the literature has been that of intra-family liquidity management (Bhattacharya, Lee, and Pool, 2013; Agarwal and Zhao, 2019), whereby affiliated funds-of-funds provide liquidity to funds that experience temporary outflows within the same family. Given that TDFs usually operate under a fund-of-funds structure, and given their fast growth within the fund industry, they are often identified as potential providers of intra-family liquidity (e.g., Massa, Moussawi, and Simonov, 2022). After all, TDFs actively reallocate between bonds and equities along the glide path, making them an ideal candidate for potential liquidity provision to bond funds in times of distress. However, these TDFs would be better equipped to provide such liquidity if their own flows are not compromised in the first place. It is thus important to document how TDF investor flows respond during the COVID-19 pandemic as well as examine whether there is any significant change in investor flow behavior before and after the pandemic.
For a sample of 3,052 share classes of 794 U.S. open-end TDFs (with target years between 2010 and 2065) between 2017 and 2022 at monthly frequency, we find the following. First, while the period prior to the pandemic marks stable and sustained inflows into these TDFs, during the COVID-19 market turmoil months between February and April 2020, we observe substantial heterogeneity in TDF flows depending on fund target horizon. In particular, short-horizon TDFs, defined as those with less than 8 years to target, bear the heavy brunt of outflows amounting to over $13.5 billion in cumulative terms, which is around 3% of their assets under management prior to the outbreak. Mid- (funds between 8 and 25 years to target) and long-horizon TDFs (funds with over 25 years to target), in contrast, actually experience cumulative inflows amounting to $3.0 billion and $7.7 billion, respectively, over the same three-month period. Thus, the investor sell-off in the TDF segment appears entirely limited to TDFs with short target horizons. This outflow from short-horizon TDFs is particularly prominent among retail share classes and funds offered by families with smaller TDF market share.
Following the immediate aftermath of the COVID-19 market turmoil, average monthly flows of TDFs across all horizons remain significantly lower over the next two and a half years compared to their pre-COVID numbers. This is particularly noticeable among short-horizon TDFs, whose average monthly inflows from May 2020 until the end of the sample period are lower by $2.6 billion than the pre-COVID figure, with a t-statistic of over 8.5 in absolute magnitude. This is partly attributable to the fact that some investors may have started withdrawing money near or following their retirement, and also to the interest rate hikes undertaken by the Federal Reserve that triggered a sharp fall in bond prices.
The fact that short-horizon TDFs experience substantial outflows during the COVID-19 market turmoil months of early 2020 is particularly important because these TDFs are much more prominent investors in the fixed income space than their longer-horizon peers. For example, whereas TDFs with the target year of 2020 on average hold a combined total of 41.0% in corporate and government bonds during our sample period, the comparable figure for TDFs with the target year of 2060 stands at a much lower 6.2%. Our results indicate that, during the run on bond funds in March 2020, short-horizon TDFsâthose that hold a lot of bond securities and are better placed to provide liquidityâwould not likely have been in a position to provide intra-family liquidity provision. If anything, flows out of short-horizon TDFs may even have exacerbated the selling pressure of affiliated bond funds and contributed toward their fragility. While long-horizon TDFs experience sustained inflows and would have thus been in a better position to provide liquidity, they invest only a very small fraction of their investment portfolios in bond securities, limiting their ability to engage in meaningful liquidity provision.
The unprecedented outflows experienced by bond funds and the ensuing sell-off in the corporate and Treasury bond markets may also plausibly have an effect on how TDF investors evaluate performance and allocate their investment capital accordingly. In the second half of the paper, we thus examine whether the COVID-19 pandemic has resulted in a change in the degree of asymmetry in the relationship between fund flow and performance. As a measure of TDF performance, we use a rolling 12-month-window four-factor model to calculate TDF alpha, with each factor capturing the excess return on broad market index for U.S. equities, U.S. bonds, international equities, and international bonds. After confirming that investors react strongly to this abnormal fund performance measure, particularly for short- and mid-horizon TDFs, we proceed to examine (i) whether there exists an asymmetry in the flow-performance relationship over our sample period, and if so, (ii) whether the degree of convexity or concavity changes before and after the COVID-19 market turmoil. To this end, we create two piecewise measures of TDF alphas, one capturing fund alpha when the TDF overperforms its horizon peers and the other capturing the below-median fund alpha. This allows us to separately examine how investors react differently to above- and below-median fund performance.
When we estimate the extent of asymmetry in the flow-performance relationship over our entire sample period, we find some evidence indicating concavity. Whereas the coefficient on above-median TDF alpha is statistically significant in all instances, the coefficient on below-median TDF alpha is substantially larger in terms of economic magnitude with statistical significance at the 5% level for the full sample and in the short- and mid-horizon segments. Long-horizon TDFs are the only segment that does not exhibit any evidence of concavity, with the coefficients on above- and below-median TDF alphas both similar in economic magnitude and lacking statistical significance. Given that short- and mid-horizon TDFs invest more on fixed income securities, our finding echoes the previous literature that reveal concavity in the flow-performance relationship of bond funds (e.g., Goldstein, Jiang, and Ng, 2017).
We further reveal strong heterogeneity in how the degree of asymmetry in the flow-performance relationship responds following the COVID-19 market turmoil depending on the target horizon. When we interact the above- and below-median quasi-piecewise TDF alpha measures with the post-COVID indicator, we find an interesting pattern. We find that short-horizon TDF investors substantially reduce their sensitivity to above-median TDF alpha during the post-COVID period but not the sensitivity to below-median TDF alpha. Given that the point estimates for above- and below-median TDF alphas are broadly comparable to each other in terms of economic magnitude prior to the market turmoil, our estimates imply a sizable increase in the degree of concavity in investor flow response to TDF performance in the aftermath of the COVID-19 turmoil. Our evidence suggests that short-horizon TDF investors may have become more aware of the prospect of costly investor outflows that they experienced firsthand and become less responsive to above-peer performance while maintaining their sensitivity to below-peer performance. In contrast, longer-horizon investorsâ flow response becomes more convex following the COVID-19 market turmoil. This is perhaps not surprising as these investors do not experience strong outflows during the early 2020 market crash episode, instead observing a much more stable investor flow base. Given that these investors invest âwith a long viewâ and are more risk tolerant, the increased convexity of their flow response is broadly in line with existing studies that find strong convex flow-performance relationship in equity funds (e.g., Ippolito, 1992; Chevalier and Ellison, 1997; Sirri and Tufano, 1998; Del Guercio and Tkac, 2002; Huang, Wei, and Yan, 2007). The fact that we observe an increase in concavity among short-horizon TDF investorsâ flow response while the opposite is true of mid- and long-horizon TDF investors is a further indication that investor behavior may have changed in response to their firsthand experience during the early parts of the pandemic.
In the final part of the analysis, we examine whether the increased concavity in flow-performance relationship among short-horizon TDFs is particularly noticeable for share classes exhibiting certain characteristics. We find the increase in concavity to be more prominent among institutional share classes and TDFs offered by fund families with smaller market shares. Furthermore, we observe more noticeable increases in the degree of concavity among share classes with high 12b-1 or overall expenses. Overall, we document a noticeable change in investor flow response to fund performance following the COVID-19 pandemic, which suggests that, in the aftermath of unprecedented outflows in bond funds (and short-horizon TDFs), investors may have become more sensitive to poor fund performance, leading to a heightened degree of concavity in the flow-performance relationship among short-horizon TDFs.
1.1 Contribution to the Literature.
This paper contributes to the literature in following ways. First, we contribute to the growing literature that examine target date funds (e.g., Elton, Gruber, de Souza, and Blake, 2015; Balduzzi and Reuter, 2019; Brown and Davies, 2021; An and Sachdeva, 2022; Mao and Wong, 2022; Massa, Moussawi, and Simonov, 2022; Mitchell and Utkus, 2022; Parker, Schoar, and Sun, 2023). Our paper is the first to examine whether there is a large outflow out of TDFs around the March 2020 market crash, and whether there is any significant change in TDFsâ flow-performance relationshipâparticularly with regards to its asymmetryâusing the fund flow data since the outbreak of the COVID-19 pandemic. In particular, we are the first to reveal substantial heterogeneity in flow patterns and the asymmetric flow-performance relationship among TDFs with different target horizons. One loosely related study to ours is Mao and Wong (2022), whose research question partly incorporates why TDFs fare better during the 2020 COVID-19 market crash than the global financial crisis of 2008-09. However, the sample period for their analysis on TDF flow-performance relationship ends before the COVID-19 market crash in 2019, and they do not examine whether there exists any asymmetry in the flow-performance relationship. To the best of our knowledge, no paper examines the flow patterns as well as the changing asymmetry in the TDF flow-performance relationship utilizing the flow data during and after the COVID-19 market turmoil. This is an increasingly pertinent and relevant question as TDFs are gaining increasing interest not only in the U.S. but also in Korea (Park, 2022).
Second, the paper contributes to the extant literature on fund flow-performance relationship, particularly with regards to the existence of convexity or concavity (e.g., Chevalier and Ellison, 1997; Sirri and Tufano, 1998; Huang, Wei, and Yan, 2007; Chen, Goldstein, and Jiang, 2010; Spiegel and Zhang, 2013; Ha, Kim, and Ko, 2014; Han, Kang, and Bae, 2021). We document substantial heterogeneity in the asymmetric flow response to TDF performance in the aftermath of the COVID-19 market turmoil depending on TDF target horizon; whereas the flow response to TDF alpha becomes more concave for short-horizon TDFs during the post-COVID period, while the opposite is true of mid- and long-horizon TDFs. Our documentation of TDF flows around the March 2020 sell-off also has a broader implication on the growing literature that examines the market stability implications of open-end mutual funds (e.g., Goldstein, Jiang, and Ng, 2017; Choi, Hoseinzade, Shin, and Tehranian, 2020; Anand, Jotikasthira, and Venkataraman, 2021; Falato, Goldstein, and Hortaçsu, 2021; Falato, Hortaçsu, Li, and Shin, 2021; Jiang, Li, Sun, and Wang, 2022; Ma, Xiao, and Zeng, 2022). We contribute to this strand of the literature by documenting that the outflows from short-horizon TDFs during the March 2020 market crash may have significantly reduced the effectiveness of intra-family liquidity provision.
Finally, the paper contributes to the rapidly growing literature on the effect of COVID-19 on various corners of the financial market (e.g., Albuquerque, Koskinen, Yang, and Zhang, 2020; Baker, Bloom, Davis, Kost, Sammon, and Viratyosin, 2020; Bretscher, Hsu, Simasek, and Tamoni, 2020; Gormsen and Koijen, 2020; Ling, Wang, and Zhou, 2020; PĂĄstor and Vorsatz, 2020; Ramelli and Wagner, 2020; Ding, Levine, Lin, and Xie, 2021; Fahlenbrach, Rageth, and Stulz, 2021; Kim and Ahn, 2021; Augustin, Sokolovski, Subrahmanyam, and Tomio, 2022). We contribute to this strand of the literature by documenting a systematic change in TDF fund investor behavior, namely a significant increase in the degree of concavity in the flow-performance relationship in the aftermath of the COVID-19 pandemic among short-horizon TDFs.
2. Data and Variable Construction
In this section, we first outline how our sample of TDFs is identified using the CRSP Survivor-Bias-Free Mutual Funds (CRSP MF) database. We then briefly explain how our variables of interest and controls are constructed and present their summary statistics.
2.1 Identifying Target Date Funds
The CRSP MF database contains Lipper style class identifiers (lipper_class) for TDFs, ranging from âMATAâ though âMATMâ for each target year from 2010 through 2060+ in five-year increments. However, these identifiers do not fully capture the universe of TDFs, given that some TDFs are classified as retirement income funds or other types of mixed-asset allocation funds. Thus, we follow Balduzzi and Reuter (2019) by extracting target year from fund names and manually inspect the data to exclude other types of funds.3) Following this manual identification procedure, we identify 3,052 share classes of 794 U.S. open-end TDFs between January 2017 and December 2022, with target years between 2010 and 2065. It is worth noting that many TDFs continue to operate past their stated target dates, and it is thus not unusual to observe 2010 or 2015 target date funds in our sample observations. We choose our sample period to be between 2017 and 2022 to ensure that the March 2020 market turmoil falls roughly in the middle of the specified period. The combined total assets under management (AUM) of our sample TDF for year-ends 2020 and 2021 stand at $1.53 trillion and $1.75 trillion respectively, which is very close to the reported figures of all TDFs at $1.59 trillion and $1.81 trillion in the ICI Factbook 2022.
2.2. Fund Flows and Control Variables
We construct the monthly flow of fund i in month t using the standard definition, namely:
Where ri,t is the fundâs month t return. Given that fund flow is the main variable of interest, we follow Goldstein, Jiang, and Ng (2017) and run regressions at the share class-month level, without aggregating individual share class data into fund level. This allows us to separately examine different investor responses between institutional and retail share classes, for example.4) In addition to fund flows and returns, we use the CRSP MF database to construct various control variables, namely log share class size, years to target, expense ratio, fund turnover, 12b-1 expenses, ETF indicator, institutional class indicator, and load fee class indicator, the last of which follows the definition of Choi, Kronlund, and Oh (2022). Appendix A describes in detail how each control variable is constructed. We winsorized all continuous variables at the 1% and 99% levels.
2.3 Measuring TDF Performance
TDFs rebalance their portfolios periodically and repeatedly along the glide path, which poses a challenge in terms of measuring their performance accurately. On the one hand, a longer estimation window for factor loading estimation may reduce the estimation errors, but on the other hand, it may not yield an accurate picture of the TDFsâ current exposure to different asset classes given the constant rebalancing along the glide path. Thus, we opt for a relatively short 12-month estimation window when we estimate alphas.5) In light of the previous literature (e.g., Balduzzi and Reuter, 2019; Mao and Wong, 2022), and taking into account of asset classes that TDFs usually invest in, we consider a four-factor model. Specifically, at each month-end, we consider the excess return above the risk-free rate on the (i) CRSP value-weighted index, (ii) Bloomberg Barclays U.S. Aggregate Total Return index, (iii) MSCI All-Country Weighted Index (ACWI) ex U.S. index, and (iv) Bloomberg Barclays Global Aggregate ex USD Total Return index, each capturing the U.S. equity, U.S. bond, foreign equity, and foreign bond asset classes.6) We then run rolling 12-month regression at the monthly frequency to obtain each TDFâs alpha at each month-end. In Table A.3 in the Appendix, we consider two other factor models. First, we consider the two-factor model that includes the CRSP value-weighted and Bloomberg Barclays U.S. Aggregate Total Return indices in a similar manner to Goldstein, Jiang, and Ng (2017). Second, in addition to the four factors used in the baseline case in the paper, we further include the S&P GSCI Total Return index as the fifth factor to capture the TDFsâ exposure to the commodity market factor. In both instances, we find the results to be broadly comparable.
2.4 Summary Statistics
<Table 1> reports the summary statistics of key variables used in our empirical analysis. Average monthly flow of our sample TDFs between 2017 and 2022 stands at 1.65%, reflecting the fast growth of this market segment. The average TDF share class size is around $431 million but the median value is much smaller at $12.7 million, indicating that the distribution is likely positive skewed. The average TDF share class in our sample is around 7 years old, charges around 44 bps in annual expenses, with average fund turnover of around 36%. Over 70% of share classes in our sample cater to institutional investors, and only around 6% of our sample share classes charge a load fee, much smaller than the comparable figures for U.S. bond funds reported in Choi, Kronlund, and Oh (2022).
<Table 1>
Summary Statistics
This table reports the summary statistics of key variables used in the empirical analysis. The sample period is between January 2017 and December 2022. All continuous variables are winsorized at the 1% and 99% levels, and summary statistics are computed using winsorized values for these variables. For detailed information on how each variable is constructed, see Appendix A.
<Table 2> Panel A reports the two-way sample breakdown by target year and calendar year. We have a reasonably even distribution of target years between 2020 and 2060, with each target year consisting of 8% to 10% of the total number of observations. Funds that already reached their target years at the beginning of our sample (i.e., 2010 or 2015) as well as very-long-horizon TDFs with the target year of 2065 are relatively fewer in number, but we have over 4,000 share class-month observations even for the least populated target year of 2065. For the remainder of the analysis, we create three horizon groups on the basis of years left relative to the target year. Specifically, we refer to âshort-horizon TDFsâ as those with less than 8 years until the target, âmid-horizon TDFsâ as those between 8 and 25 years, and âlong-horizon TDFsâ as those greater than 25 years, respectively. This is broadly comparable to Massa, Moussawi, and Simonovâs (2022) grouping approach and ensures a reasonably even distribution of sample number of observations between different horizons, as is evident in <Table 2> Panel B.
<Table 2>
Sample Breakdown by Target Year and Calendar Year
Panel A of this table reports the number of observations used in the empirical analysis for each target year group and calendar year. Panel B of this table then provides the two-way sample breakdown by target horizon and calendar year.
Panel A: By Target Year
Finally, <Figure 1> reports the time series trends of total AUM of all TDFs as well as for each target year group over our sample period. Combined AUM of all TDFs in our sample increases from around $890 billion at the beginning of our sample period in January 2017, albeit with a noticeable dip around the March 2020 COVID-19 market crash. TDFsâ combined AUM subsequently recovers and reaches its peak at the end of 2021 at around $1.75 trillion before a substantial decline throughout 2022, coinciding with the sharp unexpected increase in U.S. inflation and the ensuing interest rate hikes by the Federal Reserve, with the end-of-sample-period AUM standing at $1.44 trillion by December 2022. When we focus on TDFs with different target year horizons, short- and mid-horizon TDFs have similar combined AUM at the beginning of the sample period at just under $400 billion each, while the combined AUM of long-horizon TDFs is less than a half of their short- and mid-horizon counterparts at around $140 billion. By the end of the sample period in December 2022, short- and mid-horizon TDFs continue to be broadly comparable in their size at around $600 billion each, while long-horizon TDFsâ combined assets amount to around $270 billion. The abrupt jumps at the end of 2019 and 2021 reflect the 2045 target year TDFs being reclassified from long- to mid-horizon and the 2030 target year TDFs being reclassified from mid- to short-horizon, respectively.
<Figure 1>
AUM of U.S. Target Date Funds, 2017-2022
This figure plots the monthly time series trends of U.S. target date fundsâ (TDFs) AUM between 2017 and 2022. Short-horizon TDFs are those that have less than 8 years until the target year. Mid-horizon TDFs are those between 8 and 25 years left until the target year, and long-horizon TDFs are those that have over 25 years left until the target year. All numbers are in billions of dollars.

3. TDF Flows around the COVID-19 Pandemic
In this section, we document the flow patterns around and in the aftermath of the COVID-induced market crash of March 2020. To this end, at each month-end, we aggregate the dollar value of flows for all TDFs as well as separately for each target year horizon. We then plot the time series trend of flows over our sample period in <Figure 2>. We then divide our sample period into three sub-periods, namely (i) pre-COVID-crash (up to January 2020), (ii) COVID-crash (between February and April 2020), and (iii) post-COVID-crash (from May 2020 onward). We then compute the average monthly flows of all TDFs as well as for each horizon. We further test the differences-in-mean for COVID-19 crash and post-crash periods relative to the pre-crash period. We report the results in <Table 3>.
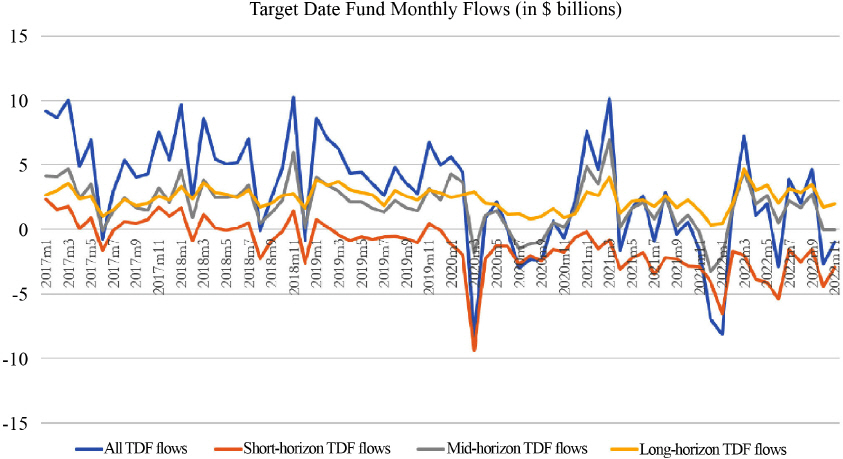
<Figure 2>
Monthly Flows into and out of U.S. Target Date Funds, 2017-2022
This figure plots the time series trends of U.S. TDF monthly flows between 2017 and 2022. Short-horizon TDFs are those that have less than 8 years until the target year. Mid-horizon TDFs are those between 8 and 25 years left until the target year, and long-horizon TDFs are those that have over 25 years left until the target year. All numbers are in billions of dollars.
<Table 3>
TDF Flows around the March 2020 COVID-19 Turmoil
In this table, we report the average monthly flows prior to, during, and after the COVID-19 turmoil. The turmoil period is defined to be between February and April 2020. We compute the average numbers for all TDFs as well as for each horizon. Then, in columns (5) through (8), we report the difference-in-mean tests of crash and post-crash periods relative to the pre-crash period. We report robust t-statistics in parentheses. * denotes significance at the 10% level, ** at the 5% level, and *** at the 1% level, respectively.
Prior to the pandemic, TDFs experience steady inflows, both on aggregate as well as for each target year horizon. Between January 2017 and January 2020, our sample TDFs receive on average $5.25 billion in inflows per month, most of which are evenly distributed between mid- and long-horizon TDFs at around $2.6 billion per month, respectively. However, during the COVID-19 crash period between February and April 2020, we observe a cumulative outflow from the TDFs. For all TDFs, the average monthly outflow stands at around $1 billion per month, which may appear modest at a first glance. We observe a much more significant outflow from short-horizon TDFs amounting to $4.5 billion per month, or $13.6 billion in cumulative terms over the three-month period. While the outflow figure for short-horizon TDFs is not as dramatic as the devastating $264 billion outflow experienced by open-end bond funds during March 2020, the observed outflow is nevertheless sizable in terms of economic magnitude, with statistical significance at the 5% level when we compare the difference-in-means relative to the pre-crash period. In contrast, mid- and long-horizon TDFs do not experience any outflow over the same period, with the average monthly inflow standing at $1.0 billion and $2.6 billion, respectively. We thus document substantial heterogeneity in flow patterns on the basis of target horizon during the turmoil.
Moreover, following the turmoil period, short-horizon TDFs continue to hemorrhage outflows; the difference in average monthly flows between pre- and post-COVID-crash periods (excluding the three-month market crash period) stands at -$2.6 billion, with a t-statistic in excess of 8 in absolute magnitude. Both mid- and long-horizon TDFsâ post-crash average monthly flows are also significantly lower than the pre-crash figures by $1.4 billion and $0.6 billion, respectively, both statistically significant at the 1% levels. As a result, the combined monthly flow of all TDFs during the post-COVID-crash period is lower than the pre-crash figure by around $4.6 billion per month, which, once again, is significant at the 1% level. This deterioration in flows across all TDFs may be attributed in part to the acceleration in the pace of U.S. inflation and the ensuing aggressive increase in the Federal Funds Rate by the Federal Reserve.
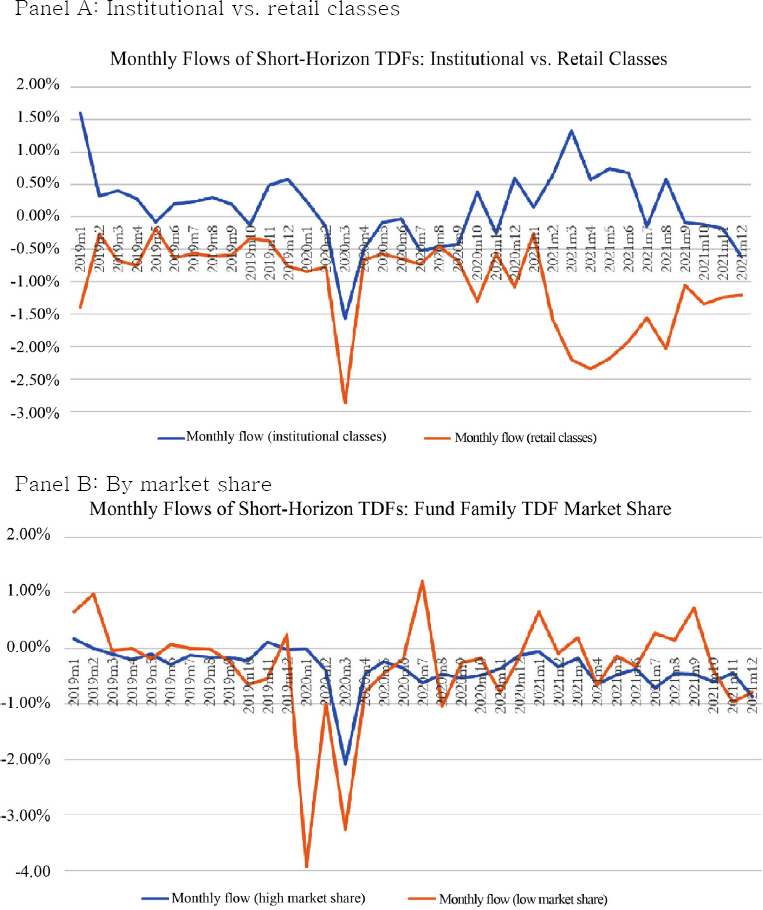
In <Figure 3>, we focus our attention on short-horizon TDFs, which bear the heavy brunt of investor outflows around the COVID-19 market crash, and separately consider (i) institutional vs. retail share classes and (ii) families with high vs. low market shares.7 In addition to examining the response of institutional vs. retail share classes, we consider the TDF market share of fund families as it is found to be an important driver of fund flows and risk-taking behavior as documented in Balduzzi and Reuter (2019). <Figure 3> Panel A reveals that, while both institutional and retail share classes experience outflows during the March 2020 market turmoil, the extent of outflows as a percentage of AUM is markedly more severe for retail share classes (-2.9%) compared to the institutional counterparts (-1.6%). Similarly, we find the extent of outflows to be much more acute among short-horizon TDFs belonging to families with smaller TDF market share (-3.3%) compared to large market share peers (-2.1%). This suggests that the outflows around the March 2020 COVID-19 market crash are particularly noticeable among short-horizon TDFs catering to retail investors.
<Figure 3>
Further Evidence on Monthly Flows of Short-Horizon TDFs Around the COVID-19 Turmoil
This figure plots the time series trends of monthly flows of short-horizon TDFs between 2019 and 2021, but separately for (i) institutional vs. retail classes and (ii) families with high vs. low TDF market share.
This has an important implication beyond the TDF segment for the following reason. Due to the fundamental design of the TDF structure, those that are closer to their target years reduce their investment in equities in favor of bonds along the glide path. For each fund-quarter in our TDF sample that reports their portfolio holdings on the CRSP MF database, we report the average percentage holdings in equities (per_com), corporate bonds (per_corp), and government bonds (per_govt) in <Table 4> for each target year group. We find that TDFs with the target year of 2020, which belong to the short-horizon segment throughout our sample period, hold around 41.0% in corporate and government bonds during our sample period. In contrast, the comparable figure for TDFs with the target year of 2060, which belong to the long-horizon segment over our sample period, only hold around 6.2%. Given that short-horizon TDFs are already much larger in their combined AUM compared to long-horizon TDFs, a simple back-of-the-envelope calculation suggests that combined bond holdings of short-horizon TDFs are likely ten to twenty times larger than those of long-horizon TDFs. Yet, during March 2020, when bond funds would likely have been in dire need of other affiliated fund-of-funds for temporary liquidity provision to mitigate the outflows to some extent, those that could have made more meaningful impact, i.e., short-horizon TDFs that hold substantial amounts in bond investments, also experience outflows of their own. While long-horizon TDFs receive inflows in contrast, their holdings in bond investments are far too small to begin with to make a material difference. This suggests that intra-family liquidity provision mechanism through the use of TDFs (Bhattacharya, Lee, and Pool, 2013; Agarwal and Zhao, 2019; Massa, Moussawi, and Simonov, 2022) may have lost effectiveness during the March 2020 market turmoil due to the outflows experienced by short-horizon TDFs.
<Table 4>
Portfolio Holdings by Target Year
We report the average portfolio holdings of our sample TDF in (i) equities, (ii) corporate bonds, and (iii) government bonds for each target year group. The figures do not sum up to 100% as these TDFs often hold other types of assets. Averages are computed using data at the fund-quarter level.
4. COVID-19 and the Asymmetry in TDF Flow-Performance Relationship
In the previous section, we reveal a sizable cumulative outflow of over $13 billion from short-horizon TDFs during the three-month period surrounding the March 2020 COVID-19 market crash. In contrast, we do not observe similar outflows for mid- and long-horizon TDFs, highlighting the existence of substantial heterogeneity in TDF investor experience around the COVID-19 market turmoil. It is thus reasonable to expect that the flow response to TDF performance may accordingly have changed in the aftermath of the COVID-19 pandemic. In particular, the outflows from short-horizon TDFs that invest a large proportion of their portfolios in bond investments may have raised investor awareness on downside risks of TDF fund flows, particularly with regards to the existence of strategic complementarity in the face of the liquidity mismatch between the fund NAV and the underlying bond portfolio. It is thus plausible that short-horizon TDF investors may exhibit stronger concavity after experiencing the outflow episodes in early 2020. In this section, we thus proceed to examine whether there is any systematic change in the asymmetry of the TDF flow-performance relationship before and after the COVID-19 pandemic.
4.1 Asymmetry in the TDF Flow-performance Relationship
We first examine whether TDF flows exhibit asymmetry throughout our sample period. As discussed in detail in Section 2.3, we first compute a four-factor TDF alpha obtained from a rolling 12-month window, with each factor representing broad market index for each asset class. In <Table A.1> in the Appendix, we first confirm that investor flows exhibit a strong monotone relationship with TDF alpha, as is the case in previous studies including Balduzzi and Reuter (2019). We obtain statistical significance at the 5% level for short- and mid-horizon TDFs but not for the long-horizon counterparts, echoing Massa, Moussawi, and Simonovâs (2022) finding that long-horizon investors reduce their attention on recent fund performance given the inherent built-in automatic rebalancing structure of the TDFs.
To examine the asymmetry in the TDF flow-performance relationship, we create two quasi-piecewise TDF alpha variables, namely TDF alpha+i,t and TDFalpha?-(i,t) TDF alpha+i,t takes the value of alpha if the TDF alpha is above or equal to the median alpha of the fundâs same horizon peers at each month-end, and zero otherwise. Analogously, TDF alpha-i,t takes the value of alpha if the TDF alpha is below the median alpha of the same horizon peers at the same point in time, and zero otherwise. This allows us to examine whether TDF investors respond differently to TDF alphas when the fund overperforms (or underperforms) its horizon peer TDFs.8) Specifically, we consider flow-performance regressions in the following form:
If we find β1< β2, investors are more sensitive to a change in alpha of identical magnitude when the TDF underperforms its peers, suggesting the existence of concavity in the flow-performance relationship. On the other hand, β1< β2, the converse holds, and the flow-performance relationship exhibits convexity. Finally, similar values of β1 and β2 suggest that the flow-performance relationship is reasonably symmetric in nature, with similar levels of sensitivity to both over- and under-performance. Equity funds are known to exhibit convexity in flow-performance relationship, i.e., well-performing funds are disproportionately more rewarded (Chevalier and Ellison, 1997; Sirri and Tufano, 1998; Huang, Wei, and Yan, 2007). In contrast, corporate bond fundsâparticularly those that invest heavily in illiquid high yield segmentâare known to exhibit concavity, with poor-performing funds disproportionately punished (Goldstein, Jiang, and Ng, 2017). Given that TDFs are hybrid instruments that invest in both equity and fixed income instruments, it remains an open question the direction and the magnitude of the asymmetry of the flow-performance relationship. In addition to these piecewise TDF alpha variables, we further include the previous month-end values of log share class size, time to target year, expense ratio, turnover ratio, 12b-1 expenses, ETF indicator, institutional class indicator, and load fee class indicator as controls. We further include horizon-by-month fixed effect in all specification, which captures any unobserved heterogeneity at the target horizon level at each month. We report t-statistics computed using standard errors that are robust to heteroskedasticity and two-way clustered by share class and year-month. <Table 5> presents the regression results for the full sample period.
<Table 5>
Asymmetry in the Flow-Performance Sensitivity of TDFs
This table reports monthly regression results of TDF flow on two piecewise TDF alpha measures TDF alpha+i,t and TDF alpha? âi,t, as well as various controls. In column (1), we report the results for all TDFs in our sample, while we run separate regressions for short-, mid-, and long-horizon TDFs in columns (2) through (4), with the definition identical to those employed in Figures 1 through 3. TDF alpha+i,t takes the value of rolling 12-month four-factor TDF alpha if the alpha is above or equal to the median value of the TDFâs same horizon peers at month t, and zero otherwise. TDF alpha âi,t takes the value of the TDF alpha if the alpha is below the median value of the horizon peers and zero otherwise in the analogous manner. Control variables are log fund size, years to target, expense ratio, turnover ratio, 12b-1 expenses, ETF indicator, institutional class indicator, and load fee class indicator. All controls are previous month-end values. Regressions are conducted at the share class-month level. All specifications include horizon-by-month fixed effect. All variables are expressed in raw (not percentage) values. t-statistics computed from standard errors that are robust to heteroskedasticity and two-way clustered by share class and month are reported in parentheses. * denotes statistical significance at the 10% level, ** at the 5% level, and *** at the 1% level, respectively.
<Table 5> column (1) presents the results for all TDFs in our sample. We find that TDF investors react more strongly to TDF underperformance. When a TDF overperforms relative to its horizon peers, we find the coefficient on the alpha term to be insignificant with a point estimate of 0.65. In contrast, when a TDFâs 12-month alpha is below the median value of its horizon peers, a 1% fall in alpha brings about a 1.36% outflow, with statistical significance at the 5% level, which is more than double the case of above-median performance in terms of economic magnitude. When we test the statistical significance in the difference between the two coefficients, the F-statistic is close to (but not significant at) the 10% level. Other control variables are broadly in line with those reported in the existing literature, with investors committing more capital toward smaller, cheaper share classes with lower fund turnover and those that do not charge a load fee.
An interesting picture emerges when we separately consider each target horizon subsample in columns (2) through (4). As in the case of the full sample, we find the coefficient estimate on alpha to be statistically significant only for the case of below-peer performance among short-horizon TDFs, with more than double the economic magnitude compared to the case of above-peer performance. For mid-horizon TDFs, we find both coefficients to be statistically significant at the 5% level, but once again, the coefficient on TDF alpha-i,t is substantially larger, albeit without statistical significance when we formally test the difference in point estimates. In contrast, we do not find any evidence of concavity among long-horizon TDFs, with both the point estimates for TDF alpha+i,t and TDF alpha-i,t very close to each other. This is consistent with the existing literature that finds concave flow-performance relationship among bond funds and a more convex relationship among more liquid equity funds; we find the concavity to be more pronounced among short-horizon TDFs that invest a greater proportion of their portfolios on bonds.
4.2 COVID-19 and the Asymmetry in the TDF Flow-performance Relationship
We now proceed to examine whether there is a significant change in the degree of asymmetry in flow response to TDF alpha before and after the COVID-19 pandemic. After all, it is plausible to expect that the unprecedented outflows in bond funds, and short-horizon TDFs to a lesser extent, may have increased investor awareness on payoff complementarity and first-mover advantage in open-end funds with illiquid holdings. If so, it is reasonable to surmise that the investors may have become more sensitive to poor performance in the aftermath of the COVID-induced market crash, leading to a more concave response observed in the flow-performance relationship. To this end, we interact the two piecewise TDF alpha measures, TDF alpha+i,t and TDF alpha-i,t, with the post-COVID indicator, which takes the value of one for all months from March 2020 onwards.9) Due to the inclusion of the horizon-by-month fixed effect, the standalone term for the post-COVID indicator is subsumed by the fixed effect. <Table 6> presents our results.
<Table 6>
COVID-19 and the Asymmetry in TDF Flow-Performance Relationship.
This table reports monthly regression results of TDF flow on the interaction of two piecewise TDF alpha measures, TDF alpha+i,t and TDF alphaâi,t and the post-COVID-19 indicator. In column (1), we report the results for all TDFs in our sample, while we run separate regressions for short-, mid-, and long-horizon TDFs in columns (2) through (4), with the definition identical to those employed in <Figures 1> through 3. TDF alpha+i,t takes the value of rolling 12-month four-factor TDF alpha if the alpha is above or equal to the median value of the TDFâs same horizon peers at month t, and zero otherwise. TDF alphaâi,t takes the value of the TDF alpha if the alpha is below the median value of the horizon peers and zero otherwise in the analogous manner. Post-COVID-19 indicator takes the value of one from all observations on or after March 2020, and zero otherwise. Control variables are log fund size, years to target, expense ratio, turnover ratio, 12b-1 expenses, ETF indicator, institutional class indicator, and load fee class indicator, whose point estimates we omit for brevity. All controls are previous month-end values. Regressions are conducted at the share class-month level. All specifications include horizon-by-month fixed effect. Due to the inclusion of horizon-by-month fixed effect, the standalone term for the post-COVID-19 indicator is subsumed by the fixed effect. All variables are expressed in raw (not percentage) values. t-statistics computed from standard errors that are robust to heteroskedasticity and two-way clustered by share class and month are reported in parentheses. * denotes statistical significance at the 10% level, ** at the 5% level, and *** at the 1% level, respectively.
<Table 6> column (1) presents the regression results for the full sample. For the full sample, we find a sizable decrease in the degree of concavity following the COVID-19 market turmoil. Whereas the point estimate for below-median TDF alpha, TDF alpha-i,t, is 2.60 and significant at the 1% level prior to March 2020, we find the interaction term for TDF alpha-i,tĂ Post-COVID indicator to be significantly negative with a point estimate of -2.31. Indeed, following the COVID-19 market crash, we are no longer able to reject the null hypothesis that the point estimate on the below-median TDF alpha, i.e., 2.60-2.31=0.29, is statistically significantly different from zero (with a F-statistic of 0.61).
The most interesting pattern emerges when we focus on short-horizon TDFs in column (2), which experienced sizable outflows during the COVID-19 market crash. Following the March 2020 turmoil, we find that a notable increase in the degree of concavity in the flow-performance relationship, in contrast with the full sample estimation results. Whereas the point estimates on above- and below-median TDF alphas prior to the COVID-19 market crash are both statistically significant at the 10% level and similar in terms of economic magnitude (with the coefficient on the above-median TDF alpha slightly larger in magnitude), following the COVID-19 market crash, we reveal a clear divergence. Whereas the coefficient on the above-median TDF alpha falls substantially after March 2020, the coefficient on the below-median TDF alpha remains largely unchanged. We are no longer able to reject the null that the point estimate on the above-median TDF alpha during the post-COVID-19 period, i.e., 2.59-2.63=-0.04, is statistically different from zero, but the estimate on the below-median TDF alpha continues to be significantly different from zero at the 10% level, latter with a F-statistic of 2.85. The estimates imply that, in the aftermath of the COVID-19 pandemic, investors in short-horizon TDFs exhibit a clear shift toward more concave flow-performance response, with substantially higher sensitivity to underperformance than to overperformance.
In contrast, when we focus on mid- and long-horizon TDFs in columns (3) and (4), we obtain the opposite result. In both cases, we find the fall in sensitivity to be more prominent on the downside than on the upside. For example, when we examine the mid-horizon TDFs in column (3), we find that the point estimate on the interaction of above-median TDF alpha and the post-COVID indicator to be actually positive, while the corresponding estimate for the interaction of below-median TDF alpha and the post-COVID indicator is negative and statistically significant at the 10% level. When we examine the long-horizon TDFs in column (4), we find a similar result, with the coefficient on TDF alpha-i,tĂ Post-COVID indicator amounting to -2.74 with statistical significance at the 10% level, while the corresponding coefficient on TDF alpha+i,tĂ Post-COVID indicator at -0.74 without statistical significance. Thus, for both mid- and long-horizon TDFs, we find that investors become less sensitive to underperformance, leading to a significant decline in the degree of concavity.
We thus find a clear contrast between the flow response of short-horizon TDF investors and those that invest with a longer horizon in mind. It is perhaps not surprising that the increased concavity in flow-performance relationship is observed only among short-horizon TDFs, given that this is the only TDF segment that experienced substantial outflows during the market crash episode of early 2020. In contrast, investors in mid- and long-horizon TDFs, which withstood the market turmoil of 2020 with inflows rather than outflows, become substantially less sensitive to TDF underperformance. This suggests that investor experience during the market turmoil of March 2020 may have raised greater short-horizon TDF investor awareness of the downside risks associated with capital outflows but not for investors with longer target horizons.
4.3 TDF Characteristics, COVID-19, and the Asymmetry in Flow-performance Relationship
In the final part of the analysis, we examine whether the increased concavity in the TDF flow-performance relationship found among short-horizon TDFs exhibits heterogeneity on the basis of various share class characteristics. To this end, we identify a number of characteristic that may be relevant. First, the existing literature suggests that institutional and retail fund investors may exhibit heterogeneity (Del Guercio and Tkac, 2002; Frazzini and Lamont, 2008; Keswani and Stolin, 2008; Evans and Fahlenbrach, 2012; Jiang and Yuksel, 2017). We thus separately consider institutional and retail share classes and analyze whether the asymmetry in the flow-performance relationship responds differently. Second, following Balduzzi and Reuter (2019), which highlights the important role of fund family TDF market share, we divide our sample share classes into equal-sized subsamples based on their management firmâs TDF market share, using the sample median of all short-horizon TDFs at the previous month-end as the cut-off. Third, the literature also makes a distinction between broker-sold and direct-sold funds (Bergstresser, Chalmers, and Tufano, 2009; Christoffersen, Evans, and Musto, 2013; Del Guercio and Reuter, 2014). To this end, we separate share classes with high marketing and distribution cost (i.e., 12b-1 expenses). We use the previous-month sample median of all short-horizon TDF share classes to divide our share classes into high and low 12b-1 expense subsamples. Finally, we divide our sample into cheap and expensive share classes on the basis of expense ratio, with the previous-month sample median of all short-horizon TDF share classes as the cut-off. We then re-estimate the interaction of the above- and below-median TDF alpha with the post-COVID indicator as in <Table 6>, but separately for each characteristic-based subsample. <Table 7> presents our results.
<Table 7>
COVID-19 and the Flow-Performance Concavity of Short-Horizon TDFs: Share Class Characteristics
This table reports the monthly regression results of short-horizon TDF flow on the interaction of two piecewise TDF alpha measures, TDF alpha+i,t and TDF alpha-i,t, and the post-COVID-19 indicator, as in <Table 6> column (2). However, we regress separately for (i) institutional vs. retail share classes, (ii) high vs. low fund family TDF market share funds, (iii) high vs. low 12b-1 expense funds, and (iv) expensive vs. cheap expense ratio funds. Sample median characteristic computed at previous month-end is used to distinguish various subsamples. Control variables are identical to <Table 5> and <Table 6>, whose values we omit for brevity. All controls are previous month-end values. Regressions are conducted at the share class-month level. All specifications include horizon-by-month fixed effect. Due to the inclusion of the fixed effect, the standalone term for post-COVID indicator drops out. All variables are expressed in raw (not percentage) values. t-statistics computed from standard errors that are robust to heteroskedasticity and two-way clustered by share class and month are reported in parentheses. * denotes statistical significance at the 10% level, ** at the 5% level, and *** at the 1% level, respectively.
Columns (1) and (2) report the interaction results separately for institutional and retail share classes. Prior to the COVID-19 market turmoil, we find that institutional classes exhibit more convex flow-performance relationship, with the point estimate on the above-median TDF alpha almost three times larger than the below-median counterpart, with statistical significance at the 5% level. On the other hand, retail share classes exhibit some evidence of concavity, with the point estimate on the below-median TDF alpha noticeably larger in terms of economic magnitude and with marginal statistical significance at the 10% level. Following the COVID-19 market turmoil, we find that the institutional investorsâ flow response turns much more concave; whereas the interaction term for the above-median TDF alpha and the post-COVID indicator is negative with statistical significance at the 5% level, the corresponding interaction term for the below-median TDF alpha is actually positive, albeit without statistical significance. Thus, institutional investors appear to noticeably reduce their sensitivity to above-peer TDF performance while retaining sensitivity to below-peer performance. In contrast, we do not find a similar difference in the sensitivities of short-horizon retail TDF investors to under- and over-performance. Thus, the increase in the degree of concavity in flow-performance relationship in the short-horizon TDF segment appears to be a primarily institutional-investor-driven phenomenon.
In column (3) and (4), we examine whether the flow-performance response of short-horizon TDFs change on the basis of fund family TDF market share. Prior to the COVID-19 market crash, we find that short-horizon TDF share classes belonging to families with smaller TDF market share exhibit convex flow-performance relationship, with the coefficient estimate on the below-median TDF alpha close to zero while the estimate on the above-median TDF alpha close to 4 in terms of economic magnitude with statistical significance at the 5% level. In contrast, we do not find any significant flow response to either above- or below-median TDF alpha among TDF families with larger market shares. Following the COVID-19 market crash, however, we find strong evidence indicating a rise in the degree of concavity among short-horizon TDFs belonging to smaller market share families. Whereas the coefficient on the interaction of above-median TDF alpha with the post-COVID indicator is negative, we find the below-median counterpart to be significantly positive at the 5% level, suggesting that investors reduce their sensitivity to fund performance when it overperforms the same-horizon peers while increasing their flow response to underperformance. In contrast, we do not find a similar increase in concavity among larger market share families, with the point estimate on the below-median TDF alphaâs interaction with the post-COVID indicator actually negative and larger in absolute magnitude.
Columns (5) through (8) report the results separately for (i) high vs. low 12b-1 expense share classes and (ii) expensive vs. cheap expense ratio share classes. In both instances, we reveal a similar picture. For short-horizon share classes with high 12b-1 expenses or overall expense ratios, we find the pre-COVID response to TDF alphas to be larger in terms of economic magnitude compared to their cheap counterparts. For these more expensive classes, we do not find any strong evidence of convexity or concavity in the flow-performance relationship prior to the COVID-19 market turmoil, with the point estimates on above- and below-median TDF alphas reasonably similar to each other. However, among these expensive share classes, we find a strong fall in the investor sensitivity to above-median fund performance in the aftermath of the COVID-19 market turmoil, and in both instances, formal statistical tests indicate that we can no longer reject the null of TDF alpha+i,t being significantly different from zero following the COVID-19 market turmoil. In contrast, investor response to below-median TDF alpha remains largely unchanged even in the aftermath of the COVID-19 turmoil, suggesting that the flow-performance relationship has likely become more concave for these high 12b-1 expense or overall expense ratio short-horizon TDFs. Thus, our results indicate that the increase in the degree of concavity in the flow-performance relationship appears more prominent among institutional share classes and those belonging to families with smaller market shares that charge high 12b-1 or overall expenses. This points toward the existence of substantial heterogeneity in how short-horizon TDF investors react to recent fund performance following the COVID-19 market turmoil.
4.4 Robustness
Our analysis of the asymmetry in TDF flow-performance relationship around the COVID-19 market turmoil reveals a contrasting result for short- vs. mid- and long-horizon TDFs. Whereas we reveal a sizable increase in the degree of concavity of short-horizon TDFsâ flow-performance relationship, we find a corresponding increase in the degree of convexity for mid- and long-horizon TDFs. While this is in line with the outflow vs. inflow experience around the March 2020 market crash for TDF investors with different horizons, it remains to be checked whether this result is robust to alternative performance measurement specifications. First, we check whether our main result in <Table 6>, i.e., a significant increase in the concavity among short-horizon TDFsâ flow-performance relationship, is sensitive to a different factor estimation window. To this end, we employ a rolling 24-month estimation with a minimum of 12 observations. <Table A.2> in the Appendix reveals that short-horizon TDF is the only horizon where the fall in sensitivity to above-median TDF performance following the COVID-19 outbreak is larger than that of the below-median counterpart. For mid- and long-horizon TDFs, we find the fall in sensitivity to below-median TDF performance to be larger in magnitude compared to the above-median counterpart. This is in line with our baseline finding, namely that short-horizon TDFs is the only target horizon segment that experiences an increase in the degree of concavity in the aftermath of the COVID-19, possibly due to the crippling outflows that these investors faced around the March 2020 market turmoil period.
Second, we check whether our result is sensitive to alternative factor models. As outlined earlier in Section 2.3, we consider (i) a two-factor model that includes only the U.S. equity and bond factors, as well as (ii) a five-factor model that adds a commodity factor to our baseline four-factor model. In both instances, we find that the short-horizon TDFs are the only segment where the fall in sensitivity to above-median TDF performance following the COVID-19 market turmoil is larger than that of below-median counterpart in terms of economic magnitude, indicating that the flow-performance relationship becomes more concave. For mid- and long-horizon TDFs, we continue to find the opposite result, namely that the investors become less sensitive to underperformance following the COVID-19 market turmoil, indicating a fall in the degree of concavity.
Third, it is possible that the observed patterns in the asymmetry in flow-performance relationship may be driven by the crisis months around March 2020. To check whether this is the case, we re-estimate our baseline specification in <Table 6>, albeit excluding the market turmoil months between February and April 2020, similar to the subperiod classification employed in <Table 3>. <Table A.4> in the Appendix reveals that the results remain qualitatively unchanged, with short-horizon TDFs exhibiting an increase in the degree of concavity while mid- and long-horizon TDFs exhibiting less concavity in the flow-performance relationship. This suggests that our key findings in <Table 6>, i.e., the contrasting change in the asymmetric flow response between short- vs. mid- and long-horizon TDFs, are not driven solely by the immediate effect of the March 2020 market turmoil.
4.5 Policy Implications
The analysis of the asymmetry in TDF flow-performance relationship before and after the COVID-19 market turmoil reveals an interesting contrast between the behavior of short- vs. mid- and long-horizon TDF investors. Whereas the flow response of short-horizon TDF investors becomes more concave, possibly out of increased awareness of strategic complementarity and first-mover advantage inherent in these investment vehicles that invest a sizable proportion of their assets on bond investments, mid- and long-horizon TDF investors exhibit markedly less concavity in their flow response, after having successfully navigated the turbulent market conditions around March 2020 without experiencing severe outflows. However, given the increasing regulatory concerns regarding the stability of bond funds and the possibility of another fund run, the increased concavity of short-horizon TDFs should be a cause for concern. When the flow base of these short-horizon TDFs becomes more fragile, as we have revealed throughout this section, it not only adversely affects the effectiveness of intra-family liquidity provision mechanism to bond funds but also has the potential to significantly deteriorate the welfare of TDF investors nearing or already in retirement, who need stable cash flows for their post-retirement income. Whereas long-horizon TDF investors can invest âwith a long viewâ and withstand temporary market turmoil, the adverse consequences of a possible TDF run in short-horizon segment would be far more severe. Thus, the ongoing regulatory discussion over how to alleviate the possibility of a fund run, for example through the use of swing pricing or a âliquidity backstopâ by the lender of last resort (e.g., Falato, Goldstein, and Hortaçsu, 2021; Li, Li, Macchiavelli, and Zhou, 2021; Jin, Kacperczyk, Kahraman, and Suntheim, 2022) may need to be extended to include the short-horizon TDF segment, given its important role in the market for retirement income.
5. Conclusion
In this paper, we examine the TDF flows and flow-performance relationship around the COVID-19 pandemic. Given the unprecedented outflows from open-end bond funds during the March 2020 market turmoil, searching for potential remedies to improve their liquidity provision has been the subject of much academic and regulatory interest. In contrast, empirical analysis of TDF flows before, during, and after the COVID-19 pandemic, particularly with regards to the asymmetry in the flow-performance relationship, has received relatively less attention in the academic literature. This is an important gap in the literature as these TDFs are often identified to be an important source of intra-family liquidity provision due to their fund-of-funds investment structure and hybrid mandate that enable them to provide liquidity to affiliated funds experiencing flow shocks.
Our empirical analysis reveals that the short-horizon TDFs, which hold substantial proportions of their portfolios in bond instruments, experience substantial outflows around the March 2020 market turmoil, losing more than $13.5 billion in the space of three months between February and April 2020. In contrast, mid- and long-horizon TDFs continue to receive inflows over the same period. Given that short-horizon TDFs invest substantially more bond securities compared to mid- or long-horizon TDFs, the acute outflows out of these short-horizon TDFs suggest that the intra-family liquidity provision from short-horizon TDFs, which many bond funds may have hoped during their outflow episodes, would likely have been less effective during the March 2020 market turmoil.
We further document noticeable changes to TDF flow-performance relationship following the COVID-19 pandemic. Whereas the flow-performance relationship of mid- and long-horizon TDFs becomes less concave following the COVID-19 pandemic, we find a noticeable increase in the degree of concavity among short-horizon TDFs. This is consistent with the conjecture that the acute outflow experience around the March 2020 market turmoil may have raised short-horizon TDF investorsâ awareness of the downside risks associated with heavy outflows. Given the continued popularity of TDFs as default option investment among defined contribution pension plans and given that short-horizon TDF investors are likely in more urgent need of stable post-retirement income, the increase in the degree of concavity and the ensuing increase in the flow base of short-horizon TDFs should be a cause for concern from the regulatorsâ point of view. With this in mind, the ongoing discussion over how to mitigate the possibility of another fund run in bond funds, such as the implementation of swing pricing or a suitable âliquidity backstopâ by the Federal Reserve, may also prove highly relevant in this TDF market segment as well. The important question over whether these proposed remedies can alleviate the flow fragility of short-horizon TDFs calls for future researches on the topic, both from an academic as well as from a regulatory standpoint.


